Scheme Effectiveness
The net revenue raised by the scheme, after the rebates have been issued, is split between assisting developing countries in implementing climate change action, and assisting the global shipping sector in accelerating reductions of its growing emissions through technological advances.
Consequently, the net revenue would come from consumers in developed countries only, complying with the principles of the UNFCCC. Furthermore, developing countries would be beneficiaries of such a scheme, with the most vulnerable countries to benefit most through the relevant rules and provisions applied to the disbursement of net revenue. The shipping sector should also benefit from the net revenue, potentially through a new global Maritime Technology Fund, or similar.
In order to maximize environmental effectiveness and cost-efficiency, the entire net revenue raised is to be disbursed through existing institutions for: (a) Adaptation to climate change in developing countries, (b) Mitigation programs, such as reduction of emissions from deforestation and forest degradation (REDD+), and (c) Technology R&D, transfer, and transformation to low carbon shipping.
Although not discussed in detail, it is proposed to reserve a significant pool of adaptation funding to the most vulnerable Small Island Developing States (SIDS), Least Developed Countries (LDCs) and Africa.
To illustrate the benefits and costs of such proposal, we model an average scenario for shipping emission growth, and assume carbon price scenario, as summarized in Table below (identical to the medium carbon price scenario used in IMO 2010c).
|
Parameter |
Value |
|
Annual emission growth, 2010-2030 |
2.1% |
|
Emissions in 2010; as in 2007 (MtCO2) |
870 |
|
Scheme launch date |
2015 |
|
Carbon price in: 2015; 2020; 2030 (US$/tCO2) |
22.5; 25; 40 |
|
Phase-in period (from 75% to 100% levy) |
5 years |
We assume that circa 30% of gross revenue would be spent on rebates for developing countries. We further assume that the net revenue, the remaining 70% of gross revenue, is spent on climate change mitigation, adaptation, and technology, balancing different needs. How the net revenue is allocated would be a decision by Parties. For modelling purposes we use illustrative financing assumptions as shown in Table below.
|
Rebates |
For developing countries, those that have not foregone the rebate. Used according to their sovereign decisions. May be used for national climate change fund, or similar. |
|||||||||
|
Net Revenue (70% of gross revenue) |
|
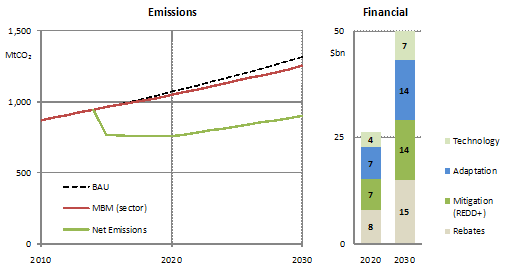
The modelled emissions and financial details are shown below.

The left graph shows three types of emissions: BAU (business as usual), MBM (sector), and Net emissions (in MtCO2). The right graph illustrates the financial details for the four target spent areas: rebates, mitigation (REDD+), adaptation, and technology for 2020 and 2030 (in US$ billions)
BAU refers to emissions without applying MBM. It already incorporates any reductions achieved through technical and operational measures. MBM (sector) refers to emissions after applying the MBM. Net Emissions shows the effect of mitigating shipping emissions from REDD+ arrangements, and similar. This line in the period 2015-2020 is nearly horizontal due to the phase-in of the scheme over the period of 5 years. From 2020, it generally follows the trend of MBM (sector) equivalent to 72% of the total, given that 28% of shipping emissions are mitigated (from the 40% of net revenue spent on mitigation).
It is anticipated that the significant technology financing proposed, for R&D and similar, would reduce shipping emissions in later years. However such benefits are not reflected in the modelling. Potential capture and sequestration of CO2 emissions are also not included.
The total cost burden of the scheme, ignoring any benefits, are circa US$26 billions in 2020 and US$50 billions in 2030, as shown in Financial figure. However, these numbers are very small when compared with the value of seaborne trade measured in US$ trillions.
We estimate the maximum potential increase in the total value of seaborne trade, due to the above cost burden, to be under 0.2% in 2020, as shown in Table below. It could be argued that at this level, the potential impact (cost impost) of the MBM on the value of seaborne trade is marginal.
|
Emissions |
Cost |
Seaborne Trade |
Cost/Seaborne Trade |
|
1,050 |
26.3 |
15.5 |
0.17 |
In conclusion, owing to the high energy efficiency of seaborne transport, the scheme would be easily affordable. Assuming that all costs are passed on to the end customers, the potential impact on them would be very small at circa 0.2% increase in final price of imported goods (this is equivalent to only $2 for every $1,000 value of imported goods). Yet, the scheme would bring significant environmental benefits as calculated above, as well as various supplemental benefits.